 Pelican
What menu engineering is
Menu engineering is a method for judging every dish on a menu by its contribution to profit, not by gut feeling. It goes back to Michael Kasavana and Donald Smith, two hospitality researchers who published it in 1982 in the book Menu Engineering: A Practical Guide to Menu Analysis. The idea has stayed the same since then: a dish has to sell, and it has to leave money once the ingredients are paid.
Food cost percentage alone does not tell you that. A steak with 45% food cost can earn more per plate than a risotto with 21%, because what goes into the till is money, not percentage points. Menu engineering therefore works with the contribution margin: net menu price minus plate cost.
Menu engineering calculator
Enter each dish of one menu section with its sales count, net menu price and plate cost. The calculator works out the margin per dish, the average margin and the popularity threshold, and puts each dish into its category.
Use net prices without sales tax and the same period for every dish. Compare dishes within one menu section, for example mains with mains. The example is the bistro from the text below; replace it with your own figures.
The menu engineering matrix: four categories
The matrix has two axes. Popularity asks whether a dish sells at least as well as you would expect for its place on the menu. Profitability asks whether its contribution margin reaches the average of the section. That gives four fields:
- Star: popular and profitable Your best dishes. They sell and they earn. Keep the recipe and the portion stable, give them the best place on the menu and make sure the team recommends them.
- Plowhorse: popular, low margin Guests love them, but each plate earns less than average. Do not take them off the menu. Look at portion size, the garnish, the purchase price or a careful price step.
- Puzzle: profitable, rarely ordered Good margin, too few orders. Often a placement or wording problem: a better spot on the menu, a clearer description, a recommendation from the service team.
- Dog: unpopular, low margin Sells little and earns little. Rework it or remove it, unless it has a job on the menu, for example as the only vegan main.
The two thresholds come from the original method. A dish counts as popular when its share of sales reaches at least 70% of an even share: with eight mains an even share is 12.5%, so the threshold is 8.75%. A dish counts as profitable when its margin is at or above the weighted average margin of all dishes sold in the section.
Worked example: eight mains in four weeks
A bistro analyses its eight mains over four weeks. Prices are net, without sales tax. In total 560 mains were sold, and together they left $6,763.50 after food cost. That gives an average contribution margin of $12.08 per main.
| Dish | Sold | Menu mix | Price | Plate cost | Margin | Category |
|---|---|---|---|---|---|---|
| Schnitzel | 120 | 21.4% | $18.50 | $5.20 | $13.30 | Star |
| Burger | 140 | 25.0% | $15.00 | $5.40 | $9.60 | Plowhorse |
| Mushroom risotto | 45 | 8.0% | $17.00 | $3.60 | $13.40 | Puzzle |
| Salmon fillet | 60 | 10.7% | $24.00 | $9.80 | $14.20 | Star |
| Braised beef | 30 | 5.4% | $22.00 | $8.90 | $13.10 | Puzzle |
| Caesar salad | 90 | 16.1% | $13.50 | $3.80 | $9.70 | Plowhorse |
| Vegan bowl | 25 | 4.5% | $14.00 | $4.90 | $9.10 | Dog |
| Rib eye steak | 50 | 8.9% | $32.00 | $14.50 | $17.50 | Star |
What the bistro learns from this:
- The steak is a star despite its food cost At 45% food cost it would look like a problem in a food cost report. With a margin of $17.50 it earns more per plate than anything else on the menu.
- The burger carries the volume, not the profit It is the best seller with 140 portions, but leaves only $9.60. Two lever options: a lower plate cost through a better bun or patty price, or a small price step.
- The risotto is a puzzle Its margin of $13.40 is above average, but only 45 guests ordered it. Before touching the recipe, the bistro moves it up the menu and lets the service team recommend it.
- The vegan bowl is a dog 25 portions, $9.10 margin. Since it is the only vegan main, the bistro keeps a vegan option but reworks the bowl with cheaper, seasonal ingredients.
Menu engineering in six steps
- Pick one section and one period Analyse mains with mains and starters with starters. Take four weeks or a quarter, without a holiday or a special event in it.
- Export the sales count per dish Your POS shows how often each dish sold. Leave out staff meals and complimentary plates.
- Work out the plate cost Cost every ingredient in the portion at today's purchase price. The food cost calculator shows how.
- Calculate margin and menu mix Margin is the net menu price minus plate cost. Menu mix is a dish's share of all dishes sold in the section.
- Sort into the four groups Popular means at least 70% of an even share. Profitable means a margin at or above the weighted average.
- Act and measure again Change a few dishes at a time, then repeat the analysis after the next period, so you can see what each change did.
What to do with each category
| Category | Typical actions | Avoid |
|---|---|---|
| Star | Best position on the menu, stable recipe and portion, recommend actively | Changing a dish that works |
| Plowhorse | Check portion and garnish, renegotiate purchase price, small price step, pair with a high margin side | Removing it, guests come for it |
| Puzzle | Better position, clearer name and description, staff recommendation, test a slightly lower price | Judging it before the menu has given it a fair chance |
| Dog | Rework with cheaper or seasonal ingredients, replace, or remove | Keeping it out of habit |
Many of these levers start in purchasing. A plowhorse often becomes a star simply because one ingredient is bought better, or because the portion is weighed instead of guessed. The guide to restaurant purchasing shows where purchase prices and quantities usually leak.
Common mistakes in menu engineering
- Gross prices Sales tax is not yours. Calculate margin from net prices, otherwise every dish looks better than it is.
- Old plate costs A plate cost from last year's prices sorts dishes into the wrong field. Update the purchase prices before each analysis.
- Mixing sections Desserts sell less often than mains on almost every menu. Compare dishes within one section.
- Specials and seasonal dishes A dish that was only on the menu for two of the four weeks will look weak. Leave it out or compare the same number of days.
- Labour is not in the margin The classic method only subtracts food cost. A dish that takes twenty minutes of prep per portion may earn less than its margin suggests. Keep that in mind when two dishes are close.
How to keep food cost under control between two analyses is covered in the guide to controlling food costs with your order history.
Where Pelican helps, and where it does not
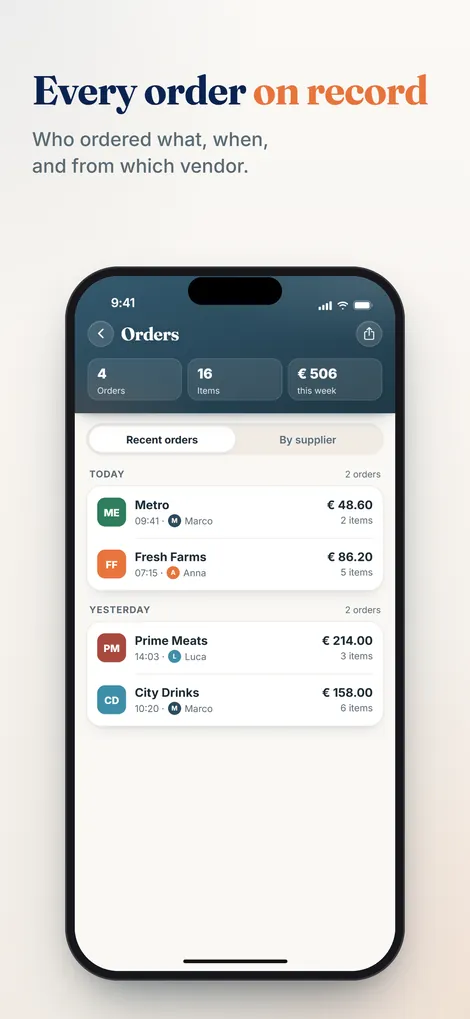
Menu engineering is only as good as the purchase prices behind the plate cost. Pelican is the ordering app for professional kitchens: the team adds what is missing to one shared list, and the order history shows what was ordered, when, from which supplier and by whom. If the team enters prices while ordering, you can see what you actually paid and how prices changed, which is the basis for an up to date plate cost.
What Pelican is not: it is not a POS and has no sales figures, so the sales count per dish comes from your till system. It does not calculate plate costs or build the matrix for you, it does not book stock in and out, it is not a guest ordering system and it does not replace your suppliers. Pelican is billed per business, not per user: Solo 19 euros per month (up to 3 users), Basic 29 euros per month (up to 5 users), Pro 59 euros per month (unlimited users). Paid yearly it is 15, 24 or 49 euros per month. Every plan starts with 30 days free.
Frequently asked questions
How often should I do menu engineering?
Whenever the menu changes, and otherwise at least once a quarter. Also after larger purchase price changes, because they move dishes between categories without anything changing on the plate.
Why use contribution margin instead of food cost percentage?
Because the margin is the money each plate leaves to pay rent, staff and profit. A dish with a high food cost percentage can still earn more per plate than a cheap dish with a low one, as the steak and the risotto in the example show.
Where does the 70% rule come from?
From the original method by Kasavana and Smith. A dish counts as popular when its share of sales reaches at least 70% of an even share. With eight dishes an even share is 12.5%, so the threshold is 8.75%.
Can I do menu engineering without a POS?
Yes, but it takes more work. You need a reliable count of portions sold per dish, for example from order tickets or a tally list kept during service. Estimates are not enough, because small differences decide the category.
Should I simply remove all dogs?
Not automatically. Some dishes have a job: the only vegetarian or vegan main, a children's dish, a dish that brings a regular group. Rework those first. Remove the ones that have no such role.
Does menu engineering also work for drinks?
Yes, as long as you analyse drinks separately from food and within comparable groups, for example wines by the glass or cocktails. Use the net price and the cost of the pour.
Current purchase prices for every plate cost
Your team orders on one shared list, prices can be entered along the way, and the order history shows what you paid and when. Try it free for 30 days.
Create business and try 30 days free